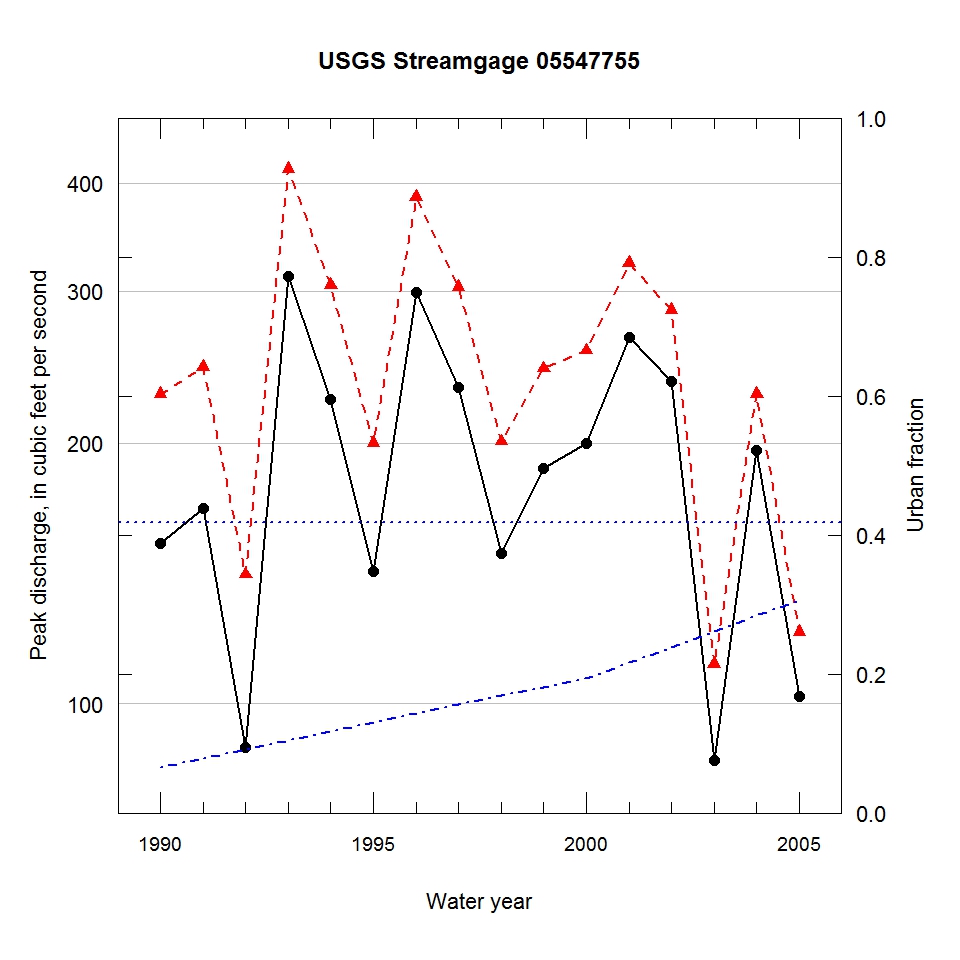
Observed and urbanization-adjusted annual maximum peak discharge and associated urban fraction and precipitation values at USGS streamgage:
05547755 SQUAW CREEK AT ROUND LAKE, IL


| Water year | Segment | Discharge code | Cumulative reservoir storage (acre-feet) | Urban fraction | Precipitation (inches) | Observed peak discharge (ft3/s) | Adjusted peak discharge (ft3/s) | Exceedance probability |
| 1990 | 1 | -- | 62 | 0.066 | 0.548 | 153 | 228 | 0.546 |
| 1991 | 1 | -- | 62 | 0.079 | 0.898 | 168 | 245 | 0.486 |
| 1992 | 1 | E | 62 | 0.092 | 0.592 | 89 | 141 | 0.836 |
| 1993 | 1 | -- | 62 | 0.105 | 0.812 | 312 | 415 | 0.135 |
| 1994 | 1 | -- | 62 | 0.117 | 0.605 | 225 | 305 | 0.314 |
| 1995 | 1 | -- | 62 | 0.130 | 1.009 | 142 | 200 | 0.646 |
| 1996 | 1 | D | 62 | 0.143 | 0.886 | 299 | 385 | 0.168 |
| 1997 | 1 | -- | 62 | 0.156 | 2.083 | 232 | 303 | 0.319 |
| 1998 | 1 | E | 62 | 0.169 | 0.495 | 149 | 201 | 0.644 |
| 1999 | 1 | -- | 62 | 0.181 | 1.017 | 187 | 244 | 0.492 |
| 2000 | 1 | -- | 62 | 0.194 | 1.923 | 200 | 256 | 0.452 |
| 2001 | 1 | -- | 62 | 0.217 | 0.745 | 265 | 323 | 0.271 |
| 2002 | 1 | -- | 62 | 0.239 | 1.839 | 236 | 285 | 0.367 |
| 2003 | 1 | CE | 62 | 0.261 | 0.676 | 86 | 111 | 0.912 |
| 2004 | 1 | C | 62 | 0.284 | 2.119 | 196 | 228 | 0.546 |
| 2005 | 1 | CE | 62 | 0.306 | 0.638 | 102 | 121 | 0.889 |

